
More Than Eight Million Workers Will Be Left Behind by the Trump Overtime Rule
By Heidi Shierholz, Economic Policy Institute
Yesterday, the U.S. Department of Labor announced its final overtime rule, which will set the salary threshold under which salaried workers are automatically entitled to overtime pay to $35,568 a year. The rule leaves behind millions of workers who would have received overtime protections under the much stronger rule, published in 2016, that Trump administration chose to abandon.
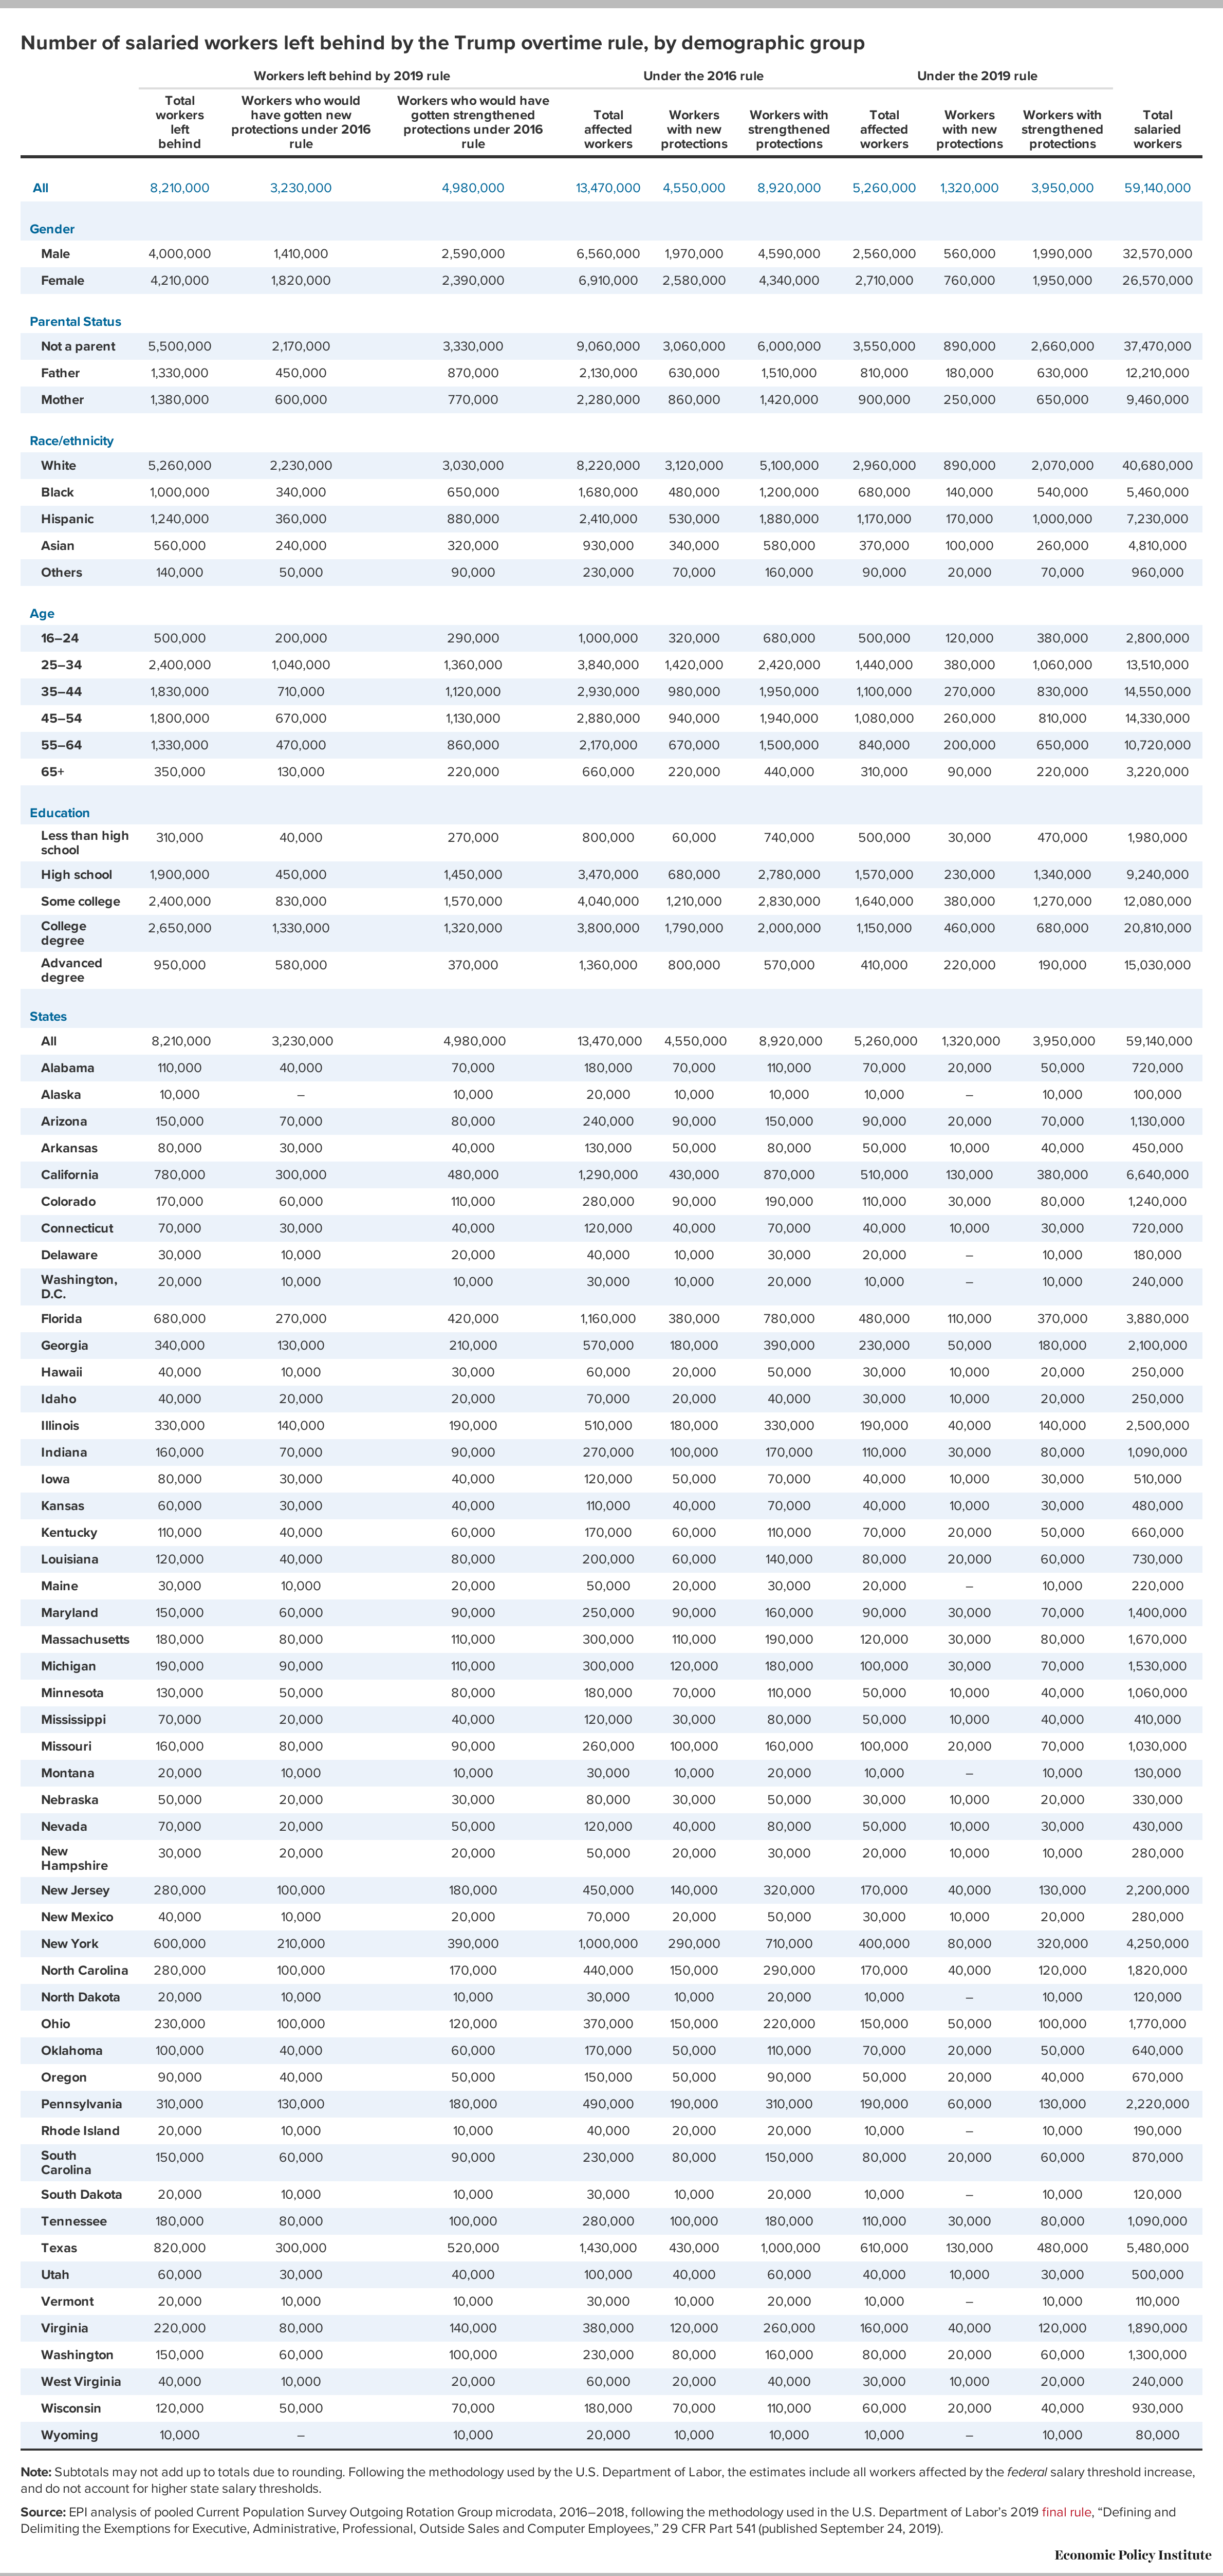
For quick details on the history of this rulemaking, see this statement. The two tables below show just how many workers this administration is turning its back on with this rule, and how much money workers will lose. Using the same methodology used by the Department of Labor in their estimates of the economic impact of the rule, I estimate that 8.2 million workers who would have benefited from the 2016 rule will be left behind by the Trump administration’s rule, including 3.2 million workers who would have gotten new overtime protections under the 2016 rule and 5.0 million who would have gotten strengthened overtime protections under the 2016 rule. As the table shows, this administration is turning its back on 4.2 million women, 2.7 million parents of children under the age of 18, 2.9 million people of color, and 4.6 million workers without a college degree.
Number of salaried workers left behind by the Trump overtime rule, by demographic group
| Workers left behind by 2019 rule | Under the 2016 rule | Under the 2019 rule | ||||||||
|---|---|---|---|---|---|---|---|---|---|---|
| Total workers left behind | Workers who would have gotten new protections under 2016 rule | Workers who would have gotten strengthened protections under 2016 rule | Total affected workers | Workers with new protections | Workers with strengthened protections | Total affected workers | Workers with new protections | Workers with strengthened protections | Total salaried workers | |
| All | 8,210,000 | 3,230,000 | 4,980,000 | 13,470,000 | 4,550,000 | 8,920,000 | 5,260,000 | 1,320,000 | 3,950,000 | 59,140,000 |
| Gender | ||||||||||
| Male | 4,000,000 | 1,410,000 | 2,590,000 | 6,560,000 | 1,970,000 | 4,590,000 | 2,560,000 | 560,000 | 1,990,000 | 32,570,000 |
| Female | 4,210,000 | 1,820,000 | 2,390,000 | 6,910,000 | 2,580,000 | 4,340,000 | 2,710,000 | 760,000 | 1,950,000 | 26,570,000 |
| Parental Status | ||||||||||
| Not a parent | 5,500,000 | 2,170,000 | 3,330,000 | 9,060,000 | 3,060,000 | 6,000,000 | 3,550,000 | 890,000 | 2,660,000 | 37,470,000 |
| Father | 1,330,000 | 450,000 | 870,000 | 2,130,000 | 630,000 | 1,510,000 | 810,000 | 180,000 | 630,000 | 12,210,000 |
| Mother | 1,380,000 | 600,000 | 770,000 | 2,280,000 | 860,000 | 1,420,000 | 900,000 | 250,000 | 650,000 | 9,460,000 |
| Race/ethnicity | ||||||||||
| White | 5,260,000 | 2,230,000 | 3,030,000 | 8,220,000 | 3,120,000 | 5,100,000 | 2,960,000 | 890,000 | 2,070,000 | 40,680,000 |
| Black | 1,000,000 | 340,000 | 650,000 | 1,680,000 | 480,000 | 1,200,000 | 680,000 | 140,000 | 540,000 | 5,460,000 |
| Hispanic | 1,240,000 | 360,000 | 880,000 | 2,410,000 | 530,000 | 1,880,000 | 1,170,000 | 170,000 | 1,000,000 | 7,230,000 |
| Asian | 560,000 | 240,000 | 320,000 | 930,000 | 340,000 | 580,000 | 370,000 | 100,000 | 260,000 | 4,810,000 |
| Others | 140,000 | 50,000 | 90,000 | 230,000 | 70,000 | 160,000 | 90,000 | 20,000 | 70,000 | 960,000 |
| Age | ||||||||||
| 16–24 | 500,000 | 200,000 | 290,000 | 1,000,000 | 320,000 | 680,000 | 500,000 | 120,000 | 380,000 | 2,800,000 |
| 25–34 | 2,400,000 | 1,040,000 | 1,360,000 | 3,840,000 | 1,420,000 | 2,420,000 | 1,440,000 | 380,000 | 1,060,000 | 13,510,000 |
| 35–44 | 1,830,000 | 710,000 | 1,120,000 | 2,930,000 | 980,000 | 1,950,000 | 1,100,000 | 270,000 | 830,000 | 14,550,000 |
| 45–54 | 1,800,000 | 670,000 | 1,130,000 | 2,880,000 | 940,000 | 1,940,000 | 1,080,000 | 260,000 | 810,000 | 14,330,000 |
| 55–64 | 1,330,000 | 470,000 | 860,000 | 2,170,000 | 670,000 | 1,500,000 | 840,000 | 200,000 | 650,000 | 10,720,000 |
| 65+ | 350,000 | 130,000 | 220,000 | 660,000 | 220,000 | 440,000 | 310,000 | 90,000 | 220,000 | 3,220,000 |
| Education | ||||||||||
| Less than high school | 310,000 | 40,000 | 270,000 | 800,000 | 60,000 | 740,000 | 500,000 | 30,000 | 470,000 | 1,980,000 |
| High school | 1,900,000 | 450,000 | 1,450,000 | 3,470,000 | 680,000 | 2,780,000 | 1,570,000 | 230,000 | 1,340,000 | 9,240,000 |
| Some college | 2,400,000 | 830,000 | 1,570,000 | 4,040,000 | 1,210,000 | 2,830,000 | 1,640,000 | 380,000 | 1,270,000 | 12,080,000 |
| College degree | 2,650,000 | 1,330,000 | 1,320,000 | 3,800,000 | 1,790,000 | 2,000,000 | 1,150,000 | 460,000 | 680,000 | 20,810,000 |
| Advanced degree | 950,000 | 580,000 | 370,000 | 1,360,000 | 800,000 | 570,000 | 410,000 | 220,000 | 190,000 | 15,030,000 |
Note: Subtotals may not add up to totals due to rounding. Following the methodology used by the U.S. Department of Labor, the estimates include all workers affected by the federal salary threshold increase, and do not account for higher state salary thresholds.
Source: EPI analysis of pooled Current Population Survey Outgoing Rotation Group microdata, 2016–2018, following the methodology used in the U.S. Department of Labor’s 2019 final rule, “Defining and Delimiting the Exemptions for Executive, Administrative, Professional, Outside Sales and Computer Employees,” 29 CFR Part 541 (published September 24, 2019).
With this rule, the Trump administration is cheating workers out of billions. The annual wage gains from this rule are $1.4 billion dollars less than they would have been under the 2016 rule—and these annual earnings losses balloon over time because the Trump administration neglected to include automatic indexing in their rule. Once again, President Trump has turned his back on the working people of this country.
The total annual wages workers will lose under the Trump overtime rule will grow to $1.6 billion in the first 10 years of implementationProjected wages workers lose under the Trump overtime rule relative to the 2016 rule in the first 10 years of implementation of the Trump rule
| Projected standard threshold under the 2016 rule | Standard threshold under the 2019 rule | Wages lost under the 2019 rule relative to the 2016 rule | Total wage increase under the 2016 rule | Total wage increase under the 2019 rule | |
|---|---|---|---|---|---|
| 2020 | $51,064 | $35,568 | $1,431,100,000 | $1,787,200,000 | $356,100,000 |
| 2021 | $51,064 | $35,568 | $1,334,500,000 | $1,606,000,000 | $271,500,000 |
| 2022 | $51,064 | $35,568 | $1,246,300,000 | $1,477,100,000 | $230,800,000 |
| 2023 | $55,055 | $35,568 | $1,579,900,000 | $1,770,700,000 | $190,800,000 |
| 2024 | $55,055 | $35,568 | $1,459,000,000 | $1,632,400,000 | $173,400,000 |
| 2025 | $55,055 | $35,568 | $1,360,300,000 | $1,504,200,000 | $144,000,000 |
| 2026 | $59,098 | $35,568 | $1,663,800,000 | $1,798,500,000 | $134,700,000 |
| 2027 | $59,098 | $35,568 | $1,560,800,000 | $1,687,000,000 | $126,200,000 |
| 2028 | $59,098 | $35,568 | $1,473,600,000 | $1,595,800,000 | $122,200,000 |
| 2029 | $63,346 | $35,568 | $1,826,900,000 | $1,938,300,000 | $111,400,000 |
Notes: Subtotals may not add up to totals due to rounding. Following the methodology used by the U.S. Department of Labor, the estimates include all workers affected by the federal salary threshold increase, and do not account for higher state salary thresholds. Calculations account only for wage increases of workers with new protections (i.e., they do not account for workers with strengthened protections).
Source: EPI analysis of pooled Current Population Survey Outgoing Rotation Group microdata, 2016–2018, following the methodology used in the U.S. Department of Labor’s 2019 final rule, “Defining and Delimiting the Exemptions for Executive, Administrative, Professional, Outside Sales and Computer Employees,” 29 CFR Part 541 (published September 24, 2019).